SOCIAL MEDIA:
AGENT OF TRANSMISSION
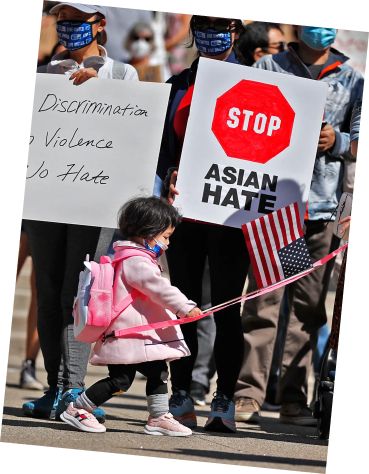
A study in the role of social media in society, reflected through the rise of anti-Asian hate and #StopAsianHate.
The COVID-19 pandemic has seen viral spread of not just the coronavirus, but also coronaracism
Coronaracism describes the racial hatred directed toward certain groups of people fueled by the COVID-19 pandemic. It refers to the indiscriminate way that all people of East Asian appearance are being targeted right now.
.Source: Media Diversity Institute
From March 2020 to 2021, over 6.6K hate incidents incidents were reported to Stop AAPI Hate.
Source: Stop AAPI Hate National Report
In this case, the agent of transmission is not droplet spread. It's existing forces of systemic oppression combined with feelings of fear, uncertainty, and vulnerability, amplified & made more contagious by the Internet.
In a May 2020 research paper, researchers from the Georgia Institute of Technology compiled 30 million tweets from Twitter, classifying each as hate, counterhate, neutral (neither hate nor counter-hate), or other (containing elements of both hate and counterhate). Below, we generate two data visualizations based on a random sample of 1 million of these tweets.Looking just at the first two classifications—hate and counterhate—we see that hate tweets are, on average, four times more frequent than counter-hate tweets. In fact, the GIT paper finds that hate is more contagious than counterhate. After their first hate tweet, hate users become more active and hateful than counterhate users, making 2.26 hateful tweets on average vs. 1.32 counterhate tweets for counterhate users.And from March 16th to March 18th, 2020, the number of hate tweets rose by 500% (in response, counter-hate rose at a similar rate) when then-President Donald Trump first used the phrase, “China Virus,” sparking a storm of anti-Asian Twitter content.Click the buttons to toggle between hate and counterhate and by day vs. cumulative figures.
Source: Georgia Institute of Technology
By Day
Hate
Counterhate
Number of Hate vs. Counterhate Tweets By Day,
January to April 2020
January to April 2020
Interact with the map below to explore the amount of hate vs. counterhate by state in the U.S. over the course of four months, from January to April 2020.Click the buttons to toggle between hate and counterhate, by day vs. cumulative, and normalized vs. absolute figures. Use the slider to see how figures change through time.
Source: Georgia Institute of Technology
Heatmap of Cumulative Number of Hate Tweets
in the U.S., Normalized by Population
in the U.S., Normalized by Population
Jan 15, 2020
Hate
Cumulative
Normalized by Population
The pervasiveness of hate is especially troubling because hate online sets the stage for real-world violence. From March 2020 to 2021, the number of incidents of online discrimination reported to Stop AAPI Hate increased by 82%. Incidents of physical assault increased by 64%.
Source: Stop AAPI Hate National Report
Given our understanding of the harms of tech, none of this is surprising.And this trend is by no means isolated to anti-Asian hate. On the Internet at large, hate has become more pervasive over time.
Why? On social media, ideas are often spread, not on the basis of merit, but on the basis of emotional stimulation.
17%
For every word of moral outrage
Outrage is “a strong moral emotion characterized by a combination of surprise, disgust, and anger.”Moral outrage is “the emotion of outrage experienced in reaction to an injustice, as such involving a moral judgement, and is often accompanied by a desire to shame and/or punish wrongdoers.”
added to a tweet, the rate at which the tweet is retweeted increases by 17%.Source: Crockett Lab
23%
Nearly a quarter of 14-18 year olds (23%) report that they “often” encounter racist content online in 2020, up from 12% in 2018.
This environment of hate came to a boiling point on March 16th, 2021, when six Asian women were among the victims of a horrific shooting in Atlanta Georgia, targeted based on gender, race, and place of work.

[When it comes to online hate], my biggest concern is the rise in physical violence against Asian people. It is unclear how much online hate results in physical violence, but racist rhetoric online for sure helps set the climate for escalations.The killings in Atlanta are a sad example of this escalation.
“
”
Gianluca Stringhini, Boston University
Soon after, social media became an agent of transmission for something else: the #StopAsianHate movement.
People took to their keyboards and screens to organize candlelight vigils and movements and educational resources, to share fundraiser links and news articles and personal testimony of the AAPI experience.
In the aftermath of the Atlanta shooting, GoFundMe started a “Stop Asian Hate Community Hub.” Here, the #1 Fundraising Platform for Crowdsourcing organizes a list of 200+ verified fundraisers created by users in support of the AAPI community.The platform places these fundraisers into five categories: for the Justice, the Safety, the Uplift, and Local Support of the AAPI community, as well as a separate category for those directly affected by the Atlanta shootings.
Seizing upon this moment of awareness, the number of #StopAsianHate campaigns directed at AAPI empowerment organizations and victims of hate increased by 207%.
Number of #StopAsianHate GoFundMe Campaigns Over Time
The proportion of #StopAsianHate fundraisers that achieved or exceeded their goals is also substantially higher than the GoFundMe average of 10%.
Percentage of Successful Fundraising Campaigns by Category
Some of these fundraisers exceeded their goals by astounding margins. Ordinary people were able to leverage their online platforms to offer material support to the Asian community and spread awareness of anti-Asian hate in the process. And this reflects the public’s greater willingness to give in the aftermath of the grisly Atlanta shooting and increased understanding of other forms of anti-Asian violence, from brutal attacks on Asian seniors to indiscriminant acts of violence committed against ordinary individuals of Asian appearace to everyday forms of racism.But by no means is this some kind of victory. Until GoFundMe platforms like these no longer need to exist, there is still more work to be done.
Thus is the duality of social media: an agent of transmission for love and for hate, a tool that can be leveraged by anyone for great good and great harm.
But by no means are online forces for good and harm balanced. If anything, the persistent, exponential rise of anti-Asian hate online throughout 2020-21 demonstrates how, left unregulated, the harm overwhelms the good.Only when online hate spills into the physical world in alarming ways is it met with a comparable wave of counter-hate. And as we have seen in the rise of #StopAsianHate, support and solidarity and education can conquer hate and lead to the real-world effects—be it millions of dollars in fundraising, new legislation and history curriculums, grassroots movements, a greater understanding of the AAPI experience—that transform society in ways both big and small.But is this just another wave that will rise, crash, recede as we once again disappear into apathy and social media doomscrolling? Or is this a first indication of a turning tide? The answer is up to all of us—tech companies, government regulators, ordinary users. Time will tell.
Built by Max & Julia • vizathon 2021